
K
KimZ
Guest
This weekend had a calm morning (0-3mph breeze) to do some testing at my home range. I shoot from a bench in the garage to a pellet trap on the driveway, 28 yd, with about the first 1/3 indoors.
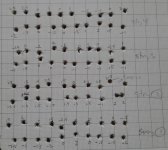
For these tests I used my RAW BM500 with poly barrel, Randolph front rest/rear bag, shooting JSB 13.4gr Monsters at HV power level. The barrel was cleaned as it is for matches (1 wet / 2 dry patches), with 5 "throw away" shots to stabilize before firing test shots. Each run consisted of 20 test shots over a chronometer, aiming at points on a graph paper target (see image). Each group of 20 consisted of 10 shots from left to right and 10 (above the first row) from right to left. There was no attempt to hold off for breezes that occurred, and I used a flag to indicate when wind was calm enough to shoot.
The tests were meant to check the effect of velocity (FPS) on vertical POI, and also the effects of pellet sorting (two batches of Monsters were sorted by a friend: weighed and air-gauged, the same as he uses in matches).
The bottom two 20-shot strings were shot with Monsters out of the can, from a lot which shoots well in my gun. The top two 20-shot strings were shot with my friend's sorted pellets.
After shooting, I used a magnifier to estimate the vertical POI distance from the horizontal POA line (X-axis). The small increments on the graph paper were 1mm, and I was able to estimate down to 0.5mm. These up (+) and down (-) POI-POA measurements were paired with the respective shot velocity from the chronometer. These measurements were then analyzed with statistics.
Here are the means (average FPS), standard error, and standard deviation (variance) of the four 20 shot groups (st1,2 out of the can, st3,4 sorted):
Descriptive Statistics: st1, st2, st3, st4
Variable N N* Mean SE Mean StDev
st1 20 0 783.85 0.805 3.60
st2 20 0 784.20 0.863 3.86
st3 20 0 783.90 0.732 3.28
st4 20 0 787.60 0.407 1.82
>>st4, one of the sorted group, had higher velocity and lower variance in velocity than the other three - which were about the same.
Here is the same analysis for vertical POI-POA distance:
Descriptive Statistics: POI1, POI2, POI3, POI4
Variable N N* Mean SE Mean StDev
POI1 20 0 -0.350 0.264 1.182
POI2 20 0 0.900 0.282 1.263
POI3 20 0 -0.125 0.294 1.317
POI4 20 0 0.500 0.281 1.257
>Note that on average POI2 shot highest (0.9mm above x-axis), even though POI4 shot fastest (about 4FPS faster). Also note that even though st4 had the lowest standard deviation of FPS, it's POI standard deviation was not the lowest.
Next I pooled data from the four strings, and looked at only POIs that were either above or below the x-axis (disregarding those that hit vertically dead-on, at zero). Here is a comparison of the mean FPS for the Up POI vs Down POI:
Two-sample T for up FPS vs dn FPS
N Mean StDev SE Mean
up FPS 36 785.67 3.58 0.60
dn FPS 26 784.69 3.38 0.66
>>As expected, for all shots velocity was higher if POI was above the line than below the line - though different only by 1FPS.
Here is another statistical test (ANOVA) comparing POI for the four 20-shot groups:
One-way ANOVA: st1, st2, st3, st4
Source DF SS MS F P
Factor 3 197.6 65.9 6.29 0.001
Error 76 796.4 10.5
Total 79 994.0
S = 3.237 R-Sq = 19.88% R-Sq(adj) = 16.72%
Individual 95% CIs For Mean Based on
Pooled StDev
Level N Mean StDev --------+---------+---------+---------+-
st1 20 783.85 3.60 (------*------)
st2 20 784.20 3.86 (------*------)
st3 20 783.90 3.28 (-------*------)
st4 20 787.60 1.82 (------*------)
--------+---------+---------+---------+-
>>Again we see the first 3 groups are almost identical (in mean velocity and variance of velocity), but one of the sorted groups st4 had higher velocity and less variance. You might think this would translate into smaller POA-POI. So to test this I compared the absolute value of POI-POA to see which, if any, group did best:
One-way ANOVA: |PO1|, |PO2|, |PO3|, |PO4|
Source DF SS MS F P
Factor 3 2.284 0.761 0.99 0.402
Error 76 58.438 0.769
Total 79 60.722
S = 0.8769 R-Sq = 3.76% R-Sq(adj) = 0.00%
Individual 95% CIs For Mean Based on
Pooled StDev
Level N Mean StDev -------+---------+---------+---------+--
|PO1| 20 0.8500 0.8751 (----------*----------)
|PO2| 20 1.3000 0.8176 (----------*----------)
|PO3| 20 0.9750 0.8656 (----------*----------)
|PO4| 20 0.9500 0.9445 (----------*----------)
-------+---------+---------+---------+--
0.70 1.05 1.40 1.75
>>The best group was the first one shot (from the can), with mean |POI-POA| of 0.85mm. The most consistent velocity sorted group (PO4) was second best. PO2 - which had a 3.5mm "flyer", shot worst.
Since score is based more on big misses than small, for I compared the absolute POI-POA of the worst 3 misses for each group:
|PO1||PO2| |PO3||PO4|
1.5 2.5 3 3
2.5 3.5 2.5 2.5
1.5 1.5 1.5 2.5
5.5 7.5 7 8 (sum)
Interestingly the sorted pellets (POI3 and 4) had the most mms of vertical miss, and the tightest velocity group PO4 had the most mm of all.
//////
These tests suggest that pellet sorting has less effect on vertical POI than other factors (barrel, breeze, etc). They also show very little correlation between vertical POI and FPS velocity. So within limits, ultra-low ES may not contribute to accuracy.
Kim
Edit: I forgot to mention that st4 had the lowest ES = 8. The others were in 12-16 range
Attachments
Last edited by a moderator:


