
JerrySharrett
Senile Member
Landy, thanks for the effort and may your ears (corn) dry without mold and may your tooth dentist be in his best scrubs.
.
.
LOL....Ron, I'm going to pray this thread is so confusing that Wilbur deletes it! But I do really appreciate what you said.Do you know the worst things about your posts? There are simply not enough of them. And, they get lost in the masses of other posts.
I'd suggest to the forum administrators that all of your posts be made into "stickies" so we wouldn't have to hunt them down.
The question makes perfect sense, but answering it with a high level of confidence is hindered by a few problems.Landy,
I'm not even certain how to ask this question. And I suspect that the answer would be merely a judgement call rather than a statistically valid one. But, let's try.
Let's say you had equipment that you felt would be competitive at the national level (would give you a reasonable chance of being in the top 10 at the ARA Nationals).
How many 5-shot groups (measured using ATC) would you need to shoot and what would the ATC need to average to make you comfortable enough to buy a few cases and shoot it at national competitions?
How's that for a totally unscientific question????????? Does the question even make sense?
Hawkeye Wizard
Landy, thanks for the effort and may your ears (corn) dry without mold and may your tooth dentist be in his best scrubs.
.
Hawkeye Wizard
Thanks. I overlooked Landy's explanation that ATC = Mean Radius. But that brings back up the question I thought I had answered in my incorrect "explanation" of why ATC is better than group size.
Landy
Why is ATC better than the Group Offset measurement in TDS? If I understand Group Offset, which I may not, it is measuring the distance of the group from center which is the desired point of impact. With ATC being the mean radius *of the group* then your group conceivably could be very small but significantly away from the center of the target and thus score poorly.
Well, to answer my own question, group offset could have a similar flaw. The group could be very well centered on the target but be a very large group and not score well.
It seems to me a combination of ATC and group offset would be most valid. Have you looked at anything like that?
Tom
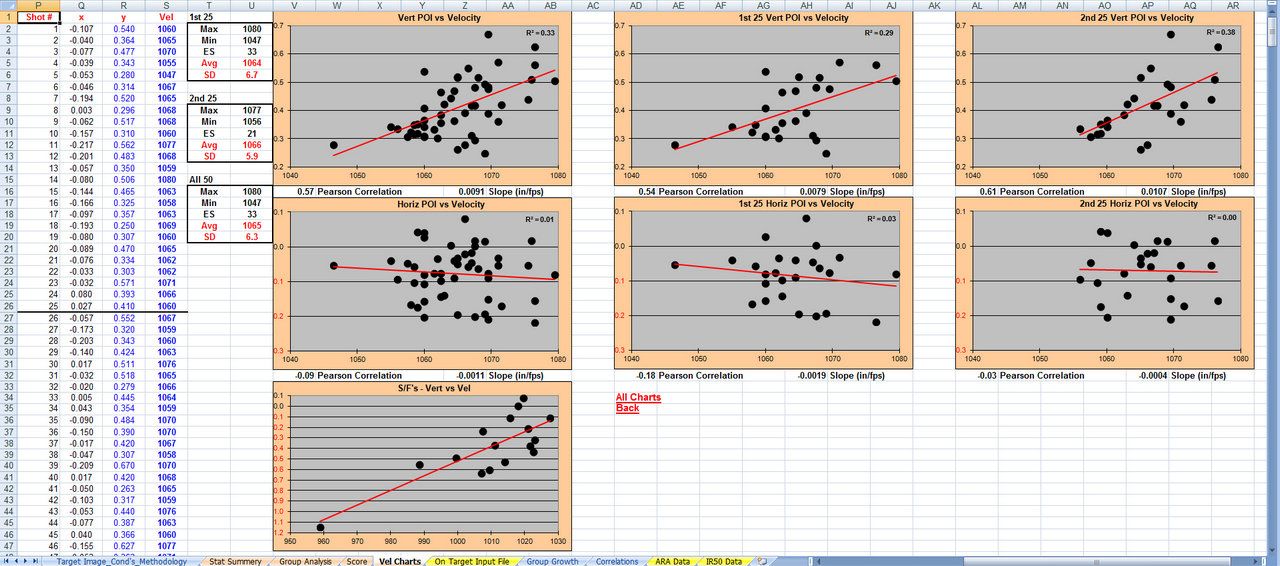
Hi Kim,Is the third regression (average distance to center vs score) measuring mean POI to center of bull for 25 bulls, then regressing this against that target's score? If so the high correlation makes perfect sense: The smaller the average distance from POI to bull center, the higher the score (score is inversely correlated with mean POI-center distance).
Yes, they're consecutive shots and not a sampling or an Excel Monte Carlo simulation. That being said, there are some advantages to using random samplings but I think this thread is confusing enough as is.The other two regressions say 2 or 5 shot groups. Are these groups "virtual"? ie sampled from scans of scored targets? If so how are the groups sampled from the targets? Consecutive shots?
Thanks
Kim
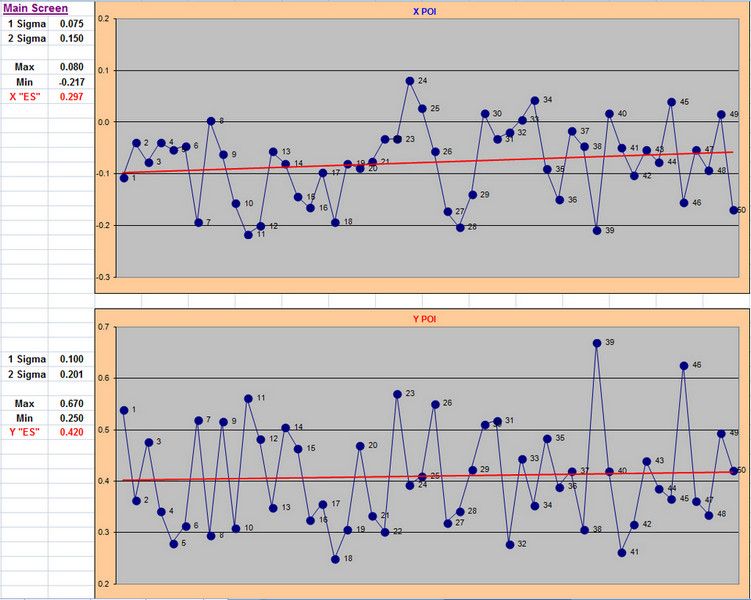
There may be other interesting information in the scanned targets. Have you looked at the direction of misses (POI to center)? ie, high, low, right, left. There could be patterns due to ammo factors, barrel temperature, change in miss direction over time, etc. Could also be interesting to check vertical miss vs chrony FPS, etc.
Kim
10-26-2016, 10:10 PM #42
HuskerP7M8
Join Date:Jul 2007Location:NebraskaPosts:344
Assuming you've been successful in gathering the data to evaluate your rifle's performance, how do you compare it to the top ten finishers at the National Matches?
When I've done this in the past I used the scores from the Indoor Nationals, the large Indoor Tournaments, and the ARA aggs for the Indoor season.
Maybe there's a way to use the outdoor results to make comparisons, but I felt the results of such an analysis would skew the results away from equipment/ammo and too much toward a competitor's skill level doping the wind.
Because I'm a data junkie I know within a fairly narrow range the performance potential of my equipment and I've been very successful in predicting where I'll finish in the large indoor matches.
I've also been somewhat successful at predicting where I'll finish in large outdoor matches, but only when the conditions are such that I'm able to narrow the gap between my skills in reading conditions and say maybe the top twenty or thirty shooters who are nearly always hanging at the top regardless of conditions.
.
Landy
[END QUOTE]
Very astute observation concerning shooter skill levels. Back when Bob Holbruner and Harry Deneen were shooting they called calm days trigger pulling contests. When the wind blew is when their talent really shined. To base results on their talent versus most shooters, would truly skew the results.
Ken Henderson
Hi Landy,Real world target scores? That reminds me of some work I've done in the last month or two and I think you and others may find it interesting. It should also assist everyone in setting benchmarks based on groups shot during your testing if your preference is to continue shooting groups rather than buying software and working with statistics you're not familiar with.
All 3 charts use the same data from a single barrel utilizing the same 3,375 shots. I didn't look, but there's probably some 30 to 40 different lots of ammo in the data.
The reason I mention the number of lots is because I believe that may be the best way to make a determination of whether or not you should give up on a barrel and/or build and start anew. If after I've tested some 20+ lots and the charts I'm presenting suggest none of the results are competitive, I'll rebarrel or start a new build. If I sell the rifle I've given up on, I'll either rebarrel it before I sell it or tell the new owner they might be better off rebarreling it because the odds are they won't be happy with it. I don't want to lay awake at night thinking I'm guilty of selling junk even if I take a hit financially.
All 3 charts show the relationship or statistical correlation to real world scores (ARA Score/C'd) for testing results using 2-shot groups, 5-shot groups, and ATC (Average To Center) also known as MR (Mean Radius).
The red line thru the data points is a trend line and in this case it's a linear trend line. Excel calculates the best fit thru the data points and creates the line.
R2 is a calculation Excel uses to tell us how well the data fits the trend line. Higher numbers are better.
Correl is the term used in the Excel formula bar and is short for correlation. Whether minus or positive, the higher the number the closer the relationship or the higher the correlation is to predicted scores.
You should notice there is some scatter that prevents you from drawing an intersecting line from the group size average in the horizontal axis of the charts and predict an exact score. This scatter is perfectly normal and can only be lessened with the addition of more data. Considering this data is composed of 135 separate tests and 3,375 total rds, it should be obvious why scores vary so much from target to target even under benign conditions with the same rifle and ammo.
The other important result to notice is how the prediction for real world scores suffers if for some reason you were to decide to use 2-shot groups in your testing. The same happens if you use anything other than groups with 5 to 6 shots in them. Testing using 2-shot, 3-shot, 10-shot groups, etc don't work well when testing ammo or evaluating rifle performance. Again, this is well known but probably unfamiliar to most of you.
There's a lot to digest here and I'm certain there will be disagreement. All I can do is present the data and let everyone draw their own conclusions.
I'd also like some input as to how understandable this is. I don't care if anyone disagrees with what I've said....just want to know how many of you can make sense of it. I'd really appreciate the input.
Thanks,
Landy
[/IMG]
There may be other interesting information in the scanned targets. Have you looked at the direction of misses (POI to center)? ie, high, low, right, left. There could be patterns due to ammo factors, barrel temperature, change in miss direction over time, etc. Could also be interesting to check vertical miss vs chrony FPS, etc.
Kim
Here's how I look at it. Lots of ammo will shoot several groups well. By shooting a whole card for score you're shooting a 25 shot group. That's why I'll shoot the whole card. That's when ugliness rears it head.
Early on I would buy ammo that grouped well. Bit me in the ass many many times. Oh did it bite me.
That's why Eley must shoot 40 shot groups in they're testing. To me its the same thing. Pretty hard to shoot a 40 shout group without being in a fixture,
Keith
