
This is an extension and (hopefully) improvement on tests described previously:
http://benchrest.com/showthread.php?97104-Vertical-POI-testing
In these tests the objective was to evaluate effects on vertical POI by comparing two groups of sorted pellets (weighed and air-gauged), and one group of unsorted from a lot that shoots well in my gun.
Like before, the target was shot on a calm morning (0-3mph breeze) at my home range. I shoot from a bench in the garage to a pellet trap on the driveway, 28 yd, with about the first 1/3 indoors.
I used my RAW BM500 with poly barrel, Randolph front rest/rear bag, and all test pellets were JSB 13.4gr Monsters at HV power level. The barrel was cleaned as it is for matches (1 wet / 2 dry patches), with 5 "throw away" shots to stabilize before firing test shots. The gun was aired up and cleaned before each pellet group. Initially I shot over the chronometer, but discovered it wasn't picking up every shot (even with factory LED lights). Since the prior tests (along with rimfire tests by others) showed a small correlation between velocity and POI, the chrony was not used. The current tests assessed variation in vertical POI aiming at a target graph printed on photo paper and fastened to a cardboard backing. I chose to ignore horizontal POI shifts - which are probably more a function of lateral wind, and used a flag to indicate when wind was calm enough to shoot.
A fellow benchrest shooter was kind enough to sort pellets by weight and air-gauge. I asked him to give me two lots that he thought would shoot differently based on his experience with sorting. I also asked that he label the lots such that I would not know which pellets would be expected to perform better - a "blind" experiment. This is to avoid subconscious biases that could affect the way I shot. He described the sorting as follows:
"The test pellets ( JSB Monster 13.4grn) were processed this way from a new tin of 400:
1. I washed all the pellets gently in warm water and dish soap. I only want to take off any lead dust or flakes.
I do not want to take off any of the factory coatings.Then gently rinse in a plastic strainer with warm water.
Then I lay them out on a towel with paper towels on the top to absorb the water. I will use a hair dryer on a warm setting
to dry them in about 10 minutes.
2. I then weigh each pellet to within one tenth of a grain and set them aside in plastic cups.
When I weighed all the pellets, I had pellets ranging from 13.1grn. to 13.8grn. Most of the pellets were 13.4 & 13.5 they were almost even
Then the 13.3 & 13.6 were about the same count, but less than the 13.4 & 13.5's. Pellets that were 13.2 & 13.7 I save until I have
enough to air gauge from other tins. The odd pellets I will save and use as throw a ways to lead the barrel after cleaning.
There were about 12 or so of these in the test tin.
3. Then I air gauged each weighed group into groups of #40 (39 to 42). #45 (43 to 46). And #50 ( 47 to 50)
The larger the number - the larger the pellet head is in size. At this time there will be more odd pellets (about 6) that air gauged 15 to 35.
So when I am done I will have group batches of matched pellets. I keep these all in separate containers.
Group A had equal number of 13.6 grn pellets with #40 gauge size and 13.3 grn pellets with #50 gauge size.
Group B were my competition pellets - 13.5grn with #50 gauge size "
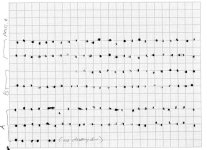
I improved measurement of the card over the last test as follows: The finished card was scanned and the resulting image (see below) was imported into MS Paint program. Paint reads out X and Y pixel coordinates on an image based on the location of the cursor, and I was able to enlarge the image so the cursor could be accurately centered in each POI perforation. For each POI Y-coordinate, I also measured the Y-coordinate for the horizontal graph line which was the actual POA. Vertical POI to POA displacement was calculated as the difference in Y between POI and POA: above the line was positive, and below was negative. (Measurement of the target showed the scale to be 6.5 pixel per mm)
I consecutively shot 54 POIs for sorted group A. After cleaning/airing, I shot 40 of group B (all the pellets in group B), and then 48 in my unsorted group (Pre). After measuring the scan, I calculated the average vertical POI displacement for each group. For A the average displacement was +0.22 pixel, B was -3.75 pixel, and Pre was -5.875 pixel. This indicates there was a drop in overall POI over the groups as I shot through group A, B, and Pre. I have also seen this during matches, and when I notice zero shift I will click the scope to re-zero. (Why? Not sure. Temperature change, scope drift, etc?) Nevertheless, since I was interested in difference in vertical POI shift between pellet groups, I adjusted each group so the average POI became zero ( by subtracting the initial averages from each group's data). These adjusted vPOIs then show deviation from a common horizontal zero. Here are the statistics:
Variable N Mean SE Mean StDev Minimum Maximum
avPOI A 54 0.00 1.32 9.71 -35.22 17.78
avPOI B 40 0.00 1.40 8.83 -17.25 14.75
avPOI pre 48 0.00 1.71 11.87 -36.13 21.88
Note the STDEV is almost the same between the two sorted groups, but higher with my unsorted pre pellets. This also shows in the Maximum (highest POIs) and Minimum values.
A "10" score can be had with a POI a few mm above or below the X. So can a 9, 8, etc. So the sign of the vertical POI (up or down) doesn't matter - what matters is how far the POI is above or below the X. The absolute value of vPOI gives this distance. Here is the breakdown of absolute vPOI:
Variable N Mean SE Mean StDev
|A| 54 7.864 0.760 5.586
|B| 40 7.400 0.738 4.666
|pre| 48 9.620 0.983 6.813
Looking at mean distance from X regardless if up or down (absolute value of vPOI), the means describe the average distance away from X (in the vertical direction). As with the prior test, the two sorted groups A and B are very close, as is their stdev. However my unsorted pellets were higher in both mean and stdev.
/////
When looking at the card, I noticed increasing vPOI in shots near the end of the longer strings. This could be due to barrel lead, air pressure, reg, etc. During a match I will usually shoot about 40 times (after initial cleaning 5) - including for score and sighters. Since the vPOI data for the three groups of 54, 40, 48 shots was recorded in order, I truncated the strings all at 40 (the length of B group) to make for a fairer comparison. Here is the absolute value vPOI data for the first 40 for the 3 groups:
Variable N Mean SE Mean StDev
|A|40 40 7.36 0.64 4.09
|B|40 40 7.40 0.73 4.67
|pre|40 40 9.03 1.08 6.85
Looking at just the first 40 shots of each string did not change the results: group A and B were about the same, but better than unsorted group "pre"
//////
How do the variances (stdev) compare between A, B, and pre? Results of these tests showed that variance was not different between groups A and B, but that both A and B had less variance than my unsorted pellets (Sparing you the test outputs on this - PM me if you want to see them)
//////
Most cards in matches are determined by a the few misses that occur - 9s, 8s, etc. So here is a comparison of the 6 worst (largest absolute vPOI) shots from the truncated 40 of group A, B, pre:
Variable N Mean SE Mean StDev
|A|40 6 6 13.593 0.270 0.662
|B|40 6 6 15.500 0.668 1.636
|pre|40 6 6 21.33 3.110 7.620
>>In this test of the worst 6 misses, the sorted pellets (A, B) were much better than the unsorted pellets. Between the sorted pellets, A was somewhat better than B.
/////////////
Though he didn't tell me beforehand, my friend who sorted the pellets constructed group B to shoot best and uses these criteria for his match pellets. Though B consistently beat my unsorted pellets, it did not beat group A - which he thought would shoot worse. And though A and B shot better than my unsorted pellets, since they were from different lots we still can't conclude that some form of washing / sorting is better than none. (Though my unsorted lot has won many HV matches) I will say that group B "felt" better to me during shooting, and looks best when eyeballing the card. But this is not borne out by the measurements and statistics. You will have to draw your own conclusions.
Truly this should be tested indoors, in a draft-free range, over many more runs than this. But within the limits of this study ( which was a lot of work!), the results of sorting - tested in range type conditions - still seems equivocal.
(to be continued)
Edit: Should read "scale to be 6.5 pixel per mm"
http://benchrest.com/showthread.php?97104-Vertical-POI-testing
In these tests the objective was to evaluate effects on vertical POI by comparing two groups of sorted pellets (weighed and air-gauged), and one group of unsorted from a lot that shoots well in my gun.
Like before, the target was shot on a calm morning (0-3mph breeze) at my home range. I shoot from a bench in the garage to a pellet trap on the driveway, 28 yd, with about the first 1/3 indoors.
I used my RAW BM500 with poly barrel, Randolph front rest/rear bag, and all test pellets were JSB 13.4gr Monsters at HV power level. The barrel was cleaned as it is for matches (1 wet / 2 dry patches), with 5 "throw away" shots to stabilize before firing test shots. The gun was aired up and cleaned before each pellet group. Initially I shot over the chronometer, but discovered it wasn't picking up every shot (even with factory LED lights). Since the prior tests (along with rimfire tests by others) showed a small correlation between velocity and POI, the chrony was not used. The current tests assessed variation in vertical POI aiming at a target graph printed on photo paper and fastened to a cardboard backing. I chose to ignore horizontal POI shifts - which are probably more a function of lateral wind, and used a flag to indicate when wind was calm enough to shoot.
A fellow benchrest shooter was kind enough to sort pellets by weight and air-gauge. I asked him to give me two lots that he thought would shoot differently based on his experience with sorting. I also asked that he label the lots such that I would not know which pellets would be expected to perform better - a "blind" experiment. This is to avoid subconscious biases that could affect the way I shot. He described the sorting as follows:
"The test pellets ( JSB Monster 13.4grn) were processed this way from a new tin of 400:
1. I washed all the pellets gently in warm water and dish soap. I only want to take off any lead dust or flakes.
I do not want to take off any of the factory coatings.Then gently rinse in a plastic strainer with warm water.
Then I lay them out on a towel with paper towels on the top to absorb the water. I will use a hair dryer on a warm setting
to dry them in about 10 minutes.
2. I then weigh each pellet to within one tenth of a grain and set them aside in plastic cups.
When I weighed all the pellets, I had pellets ranging from 13.1grn. to 13.8grn. Most of the pellets were 13.4 & 13.5 they were almost even
Then the 13.3 & 13.6 were about the same count, but less than the 13.4 & 13.5's. Pellets that were 13.2 & 13.7 I save until I have
enough to air gauge from other tins. The odd pellets I will save and use as throw a ways to lead the barrel after cleaning.
There were about 12 or so of these in the test tin.
3. Then I air gauged each weighed group into groups of #40 (39 to 42). #45 (43 to 46). And #50 ( 47 to 50)
The larger the number - the larger the pellet head is in size. At this time there will be more odd pellets (about 6) that air gauged 15 to 35.
So when I am done I will have group batches of matched pellets. I keep these all in separate containers.
Group A had equal number of 13.6 grn pellets with #40 gauge size and 13.3 grn pellets with #50 gauge size.
Group B were my competition pellets - 13.5grn with #50 gauge size "
I improved measurement of the card over the last test as follows: The finished card was scanned and the resulting image (see below) was imported into MS Paint program. Paint reads out X and Y pixel coordinates on an image based on the location of the cursor, and I was able to enlarge the image so the cursor could be accurately centered in each POI perforation. For each POI Y-coordinate, I also measured the Y-coordinate for the horizontal graph line which was the actual POA. Vertical POI to POA displacement was calculated as the difference in Y between POI and POA: above the line was positive, and below was negative. (Measurement of the target showed the scale to be 6.5 pixel per mm)
I consecutively shot 54 POIs for sorted group A. After cleaning/airing, I shot 40 of group B (all the pellets in group B), and then 48 in my unsorted group (Pre). After measuring the scan, I calculated the average vertical POI displacement for each group. For A the average displacement was +0.22 pixel, B was -3.75 pixel, and Pre was -5.875 pixel. This indicates there was a drop in overall POI over the groups as I shot through group A, B, and Pre. I have also seen this during matches, and when I notice zero shift I will click the scope to re-zero. (Why? Not sure. Temperature change, scope drift, etc?) Nevertheless, since I was interested in difference in vertical POI shift between pellet groups, I adjusted each group so the average POI became zero ( by subtracting the initial averages from each group's data). These adjusted vPOIs then show deviation from a common horizontal zero. Here are the statistics:
Variable N Mean SE Mean StDev Minimum Maximum
avPOI A 54 0.00 1.32 9.71 -35.22 17.78
avPOI B 40 0.00 1.40 8.83 -17.25 14.75
avPOI pre 48 0.00 1.71 11.87 -36.13 21.88
Note the STDEV is almost the same between the two sorted groups, but higher with my unsorted pre pellets. This also shows in the Maximum (highest POIs) and Minimum values.
A "10" score can be had with a POI a few mm above or below the X. So can a 9, 8, etc. So the sign of the vertical POI (up or down) doesn't matter - what matters is how far the POI is above or below the X. The absolute value of vPOI gives this distance. Here is the breakdown of absolute vPOI:
Variable N Mean SE Mean StDev
|A| 54 7.864 0.760 5.586
|B| 40 7.400 0.738 4.666
|pre| 48 9.620 0.983 6.813
Looking at mean distance from X regardless if up or down (absolute value of vPOI), the means describe the average distance away from X (in the vertical direction). As with the prior test, the two sorted groups A and B are very close, as is their stdev. However my unsorted pellets were higher in both mean and stdev.
/////
When looking at the card, I noticed increasing vPOI in shots near the end of the longer strings. This could be due to barrel lead, air pressure, reg, etc. During a match I will usually shoot about 40 times (after initial cleaning 5) - including for score and sighters. Since the vPOI data for the three groups of 54, 40, 48 shots was recorded in order, I truncated the strings all at 40 (the length of B group) to make for a fairer comparison. Here is the absolute value vPOI data for the first 40 for the 3 groups:
Variable N Mean SE Mean StDev
|A|40 40 7.36 0.64 4.09
|B|40 40 7.40 0.73 4.67
|pre|40 40 9.03 1.08 6.85
Looking at just the first 40 shots of each string did not change the results: group A and B were about the same, but better than unsorted group "pre"
//////
How do the variances (stdev) compare between A, B, and pre? Results of these tests showed that variance was not different between groups A and B, but that both A and B had less variance than my unsorted pellets (Sparing you the test outputs on this - PM me if you want to see them)
//////
Most cards in matches are determined by a the few misses that occur - 9s, 8s, etc. So here is a comparison of the 6 worst (largest absolute vPOI) shots from the truncated 40 of group A, B, pre:
Variable N Mean SE Mean StDev
|A|40 6 6 13.593 0.270 0.662
|B|40 6 6 15.500 0.668 1.636
|pre|40 6 6 21.33 3.110 7.620
>>In this test of the worst 6 misses, the sorted pellets (A, B) were much better than the unsorted pellets. Between the sorted pellets, A was somewhat better than B.
/////////////
Though he didn't tell me beforehand, my friend who sorted the pellets constructed group B to shoot best and uses these criteria for his match pellets. Though B consistently beat my unsorted pellets, it did not beat group A - which he thought would shoot worse. And though A and B shot better than my unsorted pellets, since they were from different lots we still can't conclude that some form of washing / sorting is better than none. (Though my unsorted lot has won many HV matches) I will say that group B "felt" better to me during shooting, and looks best when eyeballing the card. But this is not borne out by the measurements and statistics. You will have to draw your own conclusions.
Truly this should be tested indoors, in a draft-free range, over many more runs than this. But within the limits of this study ( which was a lot of work!), the results of sorting - tested in range type conditions - still seems equivocal.
(to be continued)
Edit: Should read "scale to be 6.5 pixel per mm"
Attachments
Last edited:
